Grafana
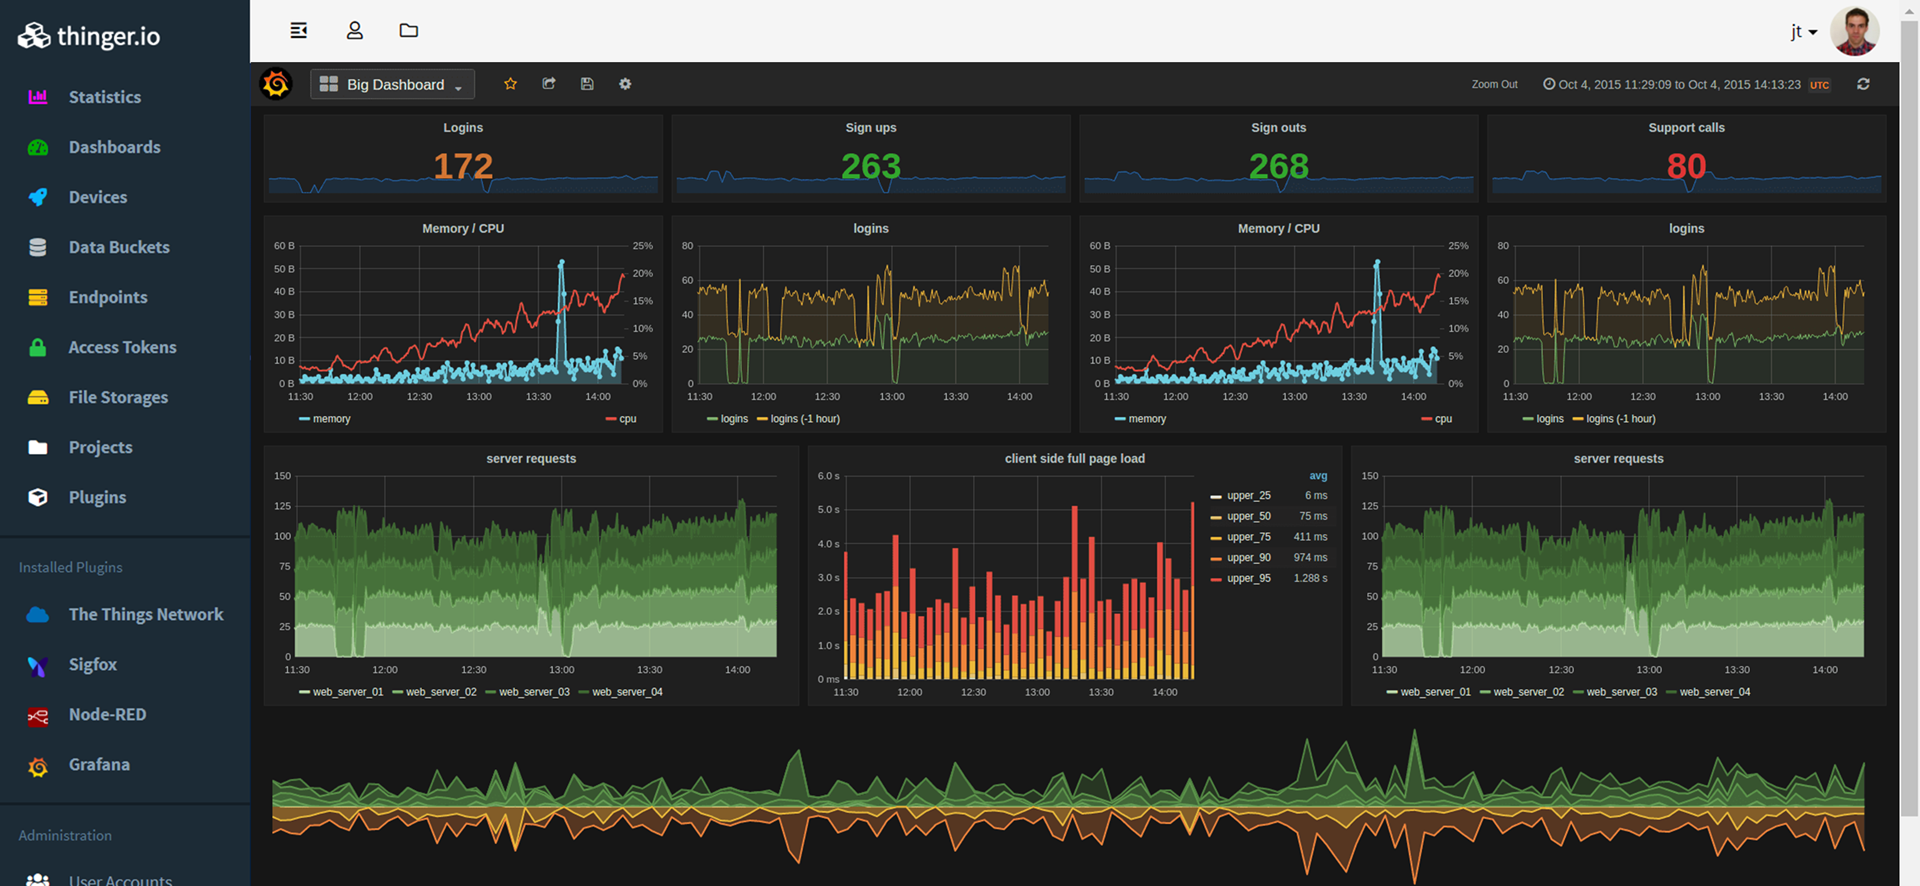
Grafana is a powerful and versatile open-source platform designed to streamline the monitoring and observability of your metrics, regardless of their storage location. With Grafana, you can effortlessly query, visualize, set up alerts, and gain deep insights into your data, fostering a data-driven culture within your team.

Key Features
1. Visualize Your Metrics with Ease
Grafana offers a blazing-fast and flexible client-side graphing capability with a myriad of customization options. The platform also supports a wide range of panel plugins, providing you with numerous ways to visualize metrics and logs exactly as you need them.
2. Dynamic and Reusable Dashboards
Create dynamic and reusable dashboards using template variables, which appear as convenient dropdowns at the top of the dashboard. This allows you to easily manipulate and interact with your data, enhancing your dashboard's usability and adaptability.
3. Explore Your Data Effortlessly
Grafana empowers you to explore your data through ad-hoc queries and dynamic drilldowns. Compare different time ranges, queries, and data sources side by side, gaining valuable insights and trends from your data with ease.
4. Seamless Transition from Metrics to Logs
Experience the seamless magic of switching between metrics and logs, with preserved label filters. Whether you need to search through all your logs or stream them live, Grafana has you covered, providing a unified monitoring experience.
5. Powerful Alerting Mechanism
Stay on top of your most critical metrics by visually defining alert rules. Grafana continuously evaluates these rules and ensures timely notifications to systems like Slack, PagerDuty, VictorOps, and OpsGenie.
6. Mix and Match Data Sources
With Grafana, you can effortlessly mix different data sources within the same graph. This includes support for custom data sources, allowing you to tailor your monitoring setup according to your specific needs.
About thinger.io and Grafana Integration

The integration of thinger.io with Grafana introduces an immensely valuable toolset for thinger.io users, enabling them to elevate their dashboards to a professional level, conduct intricate analytics in a scalable manner, and embark on collaborative visualization projects with fellow developers on their team. This seamless integration leverages the strengths of each component to create a powerful infrastructure, where thinger.io serves as a centralized hub for device administration and management.
Here's how the integration works: First, data from devices is efficiently stored using a time series data store. thinger.io acts as a facilitator, managing and organizing this data behind the scenes. Then, Grafana takes center stage, extracting the time series data and transforming it into visually compelling representations. The result is a highly effective and user-friendly monitoring and observability solution.
With this integration, users gain the ability to harness the full potential of both thinger.io and Grafana, unlocking new possibilities for data exploration, analysis, and visualization. Whether you need to fine-tune your IoT projects or collaborate with your team to drive data-driven decisions, this integration empowers you to do so with unparalleled efficiency and ease.
Begin your journey with the thinger.io and Grafana integration today and experience the true power of data-driven insights and control. Empower your projects, elevate your dashboards, and unleash the full potential of your IoT infrastructure.
Unsure if Grafana is for you? Watch Grafana in action on play.grafana.org!
Official Documentation
The Grafana documentation is available at grafana.com/docs.
License
Grafana is distributed under the Apache 2.0 License.