Working with Grafana
Creating a New Dashboard
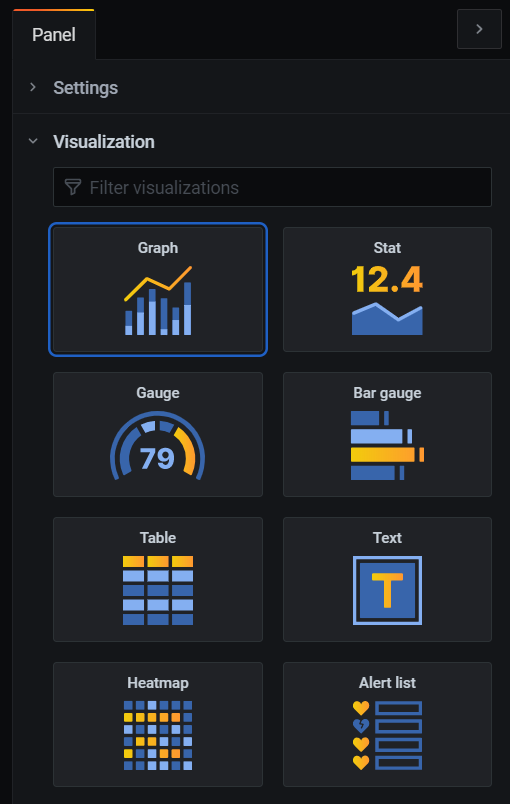
Once the data source is set up, the most common way to work with Grafana is by creating a new dashboard for data representation. Click on the "+" button in the Grafana main menu and select "New Dashboard". This opens an empty dashboard ready to be configured with custom layout and representation panels. Click on "+Add new panel" to open the panel configuration context, organized in two sections:
- Panel Configuration: Choose the type of graph to be used, such as time series charts, and explore various options for legends, axes, and more.
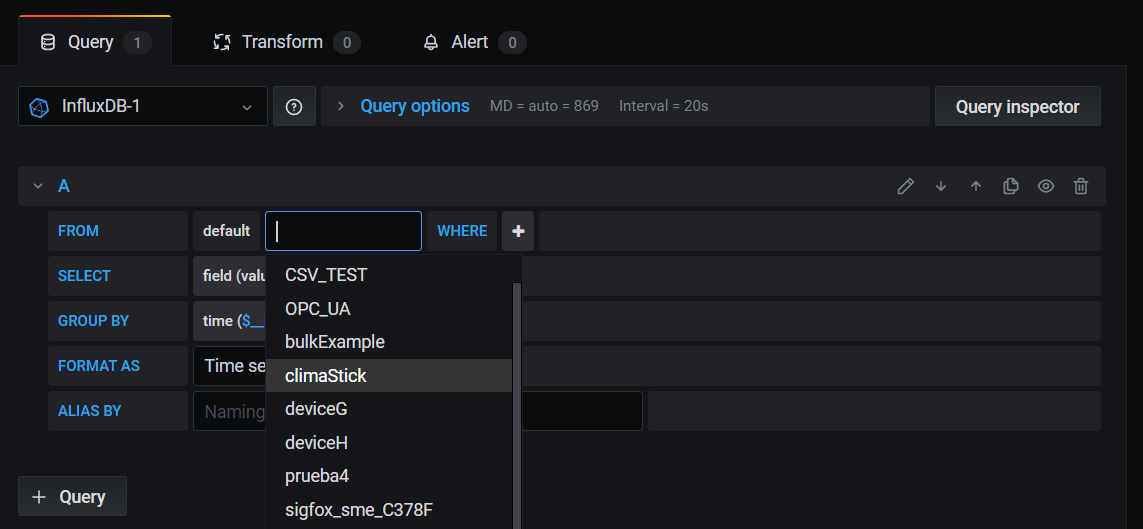
- Data Configuration in InfluxQL: Select the data source (InfluxDB2-InfluxQL in our example), a data bucket profile from Thinger.io, and specific variables for the panel.
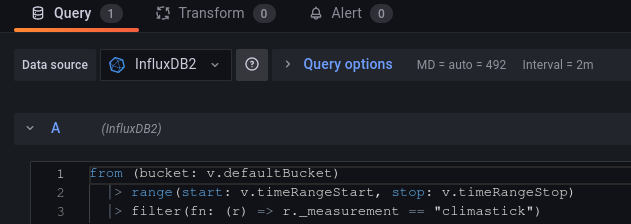
- Data Configuration in Flux: Select the data source (InfluxDB2-Flux in our example) and write the desired data using Flux syntax
-
Transform data: Filter or aggregate device data using different tools before displaying it in the panel.
-
Automatic Alerts: Configure the graph to generate real-time alerts based on evaluated variables.
Adding New Widget Types
Grafana is highly flexible, allowing users to add new panels and retrieve them from different repositories. These panels are developed by the Grafana team and community contributors, enabling rapid growth. To add new elements in the Thinger.io Grafana Plugin, use the command console of the local Docker container where Grafana is running. Execute the appropriate CLI installation command obtained from the official Grafana plugin repository.
Share Grafana Projects Publicly
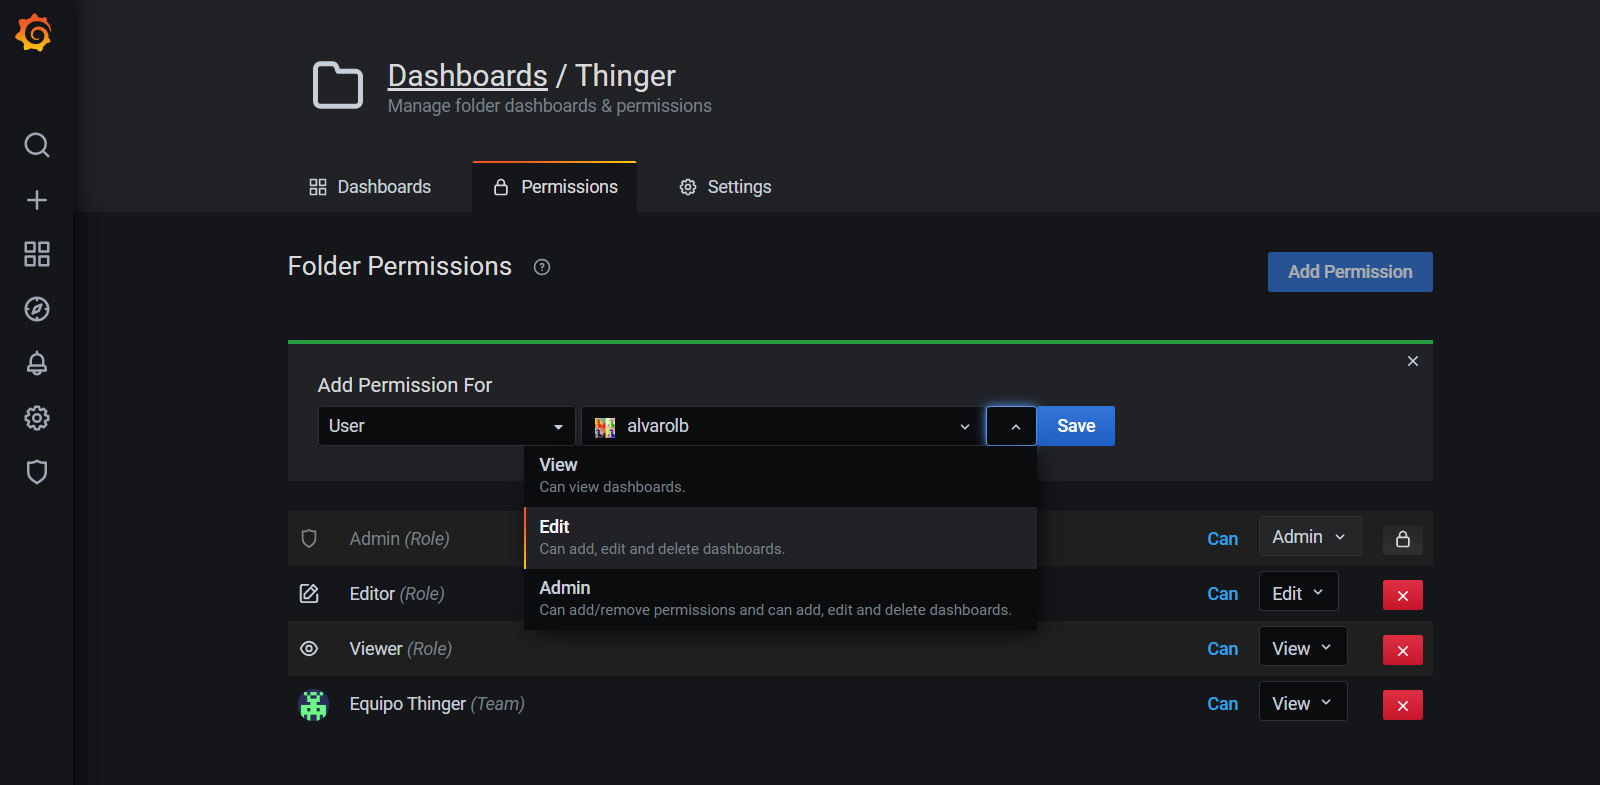
Grafana can be configured to create collaborative working groups for sharing resources with read-only or editing privileges. This feature is valuable for creating visualization interfaces for customers. To implement this:
-
Go to the "Permissions" section of the dashboard you want to share and click the blue "Add permission" button.
-
Select the user or team with whom you want to share the dashboard.
-
Choose the desired privileges to grant.
However, when Grafana is running as a Thinger.io plugin, it is neccesary to give public access to the plugin as explained in the sercion "Giving Public Access" at the managing plugins page