Prometheus Exporter
The Thinger.io Prometheus Exporter plugin is designed to facilitate the monitoring of your Thinger.io resources. It allows you to expose metrics in Prometheus formats through a dedicated endpoint.
This exporter provides you with the flexibility to define and configure metrics according to your requirements. It supports dynamic value extraction from three available backends:
- Thinger.io Database
- Data Buckets (Coming soon)
- Thinger.io API (Coming soon)
Getting Started
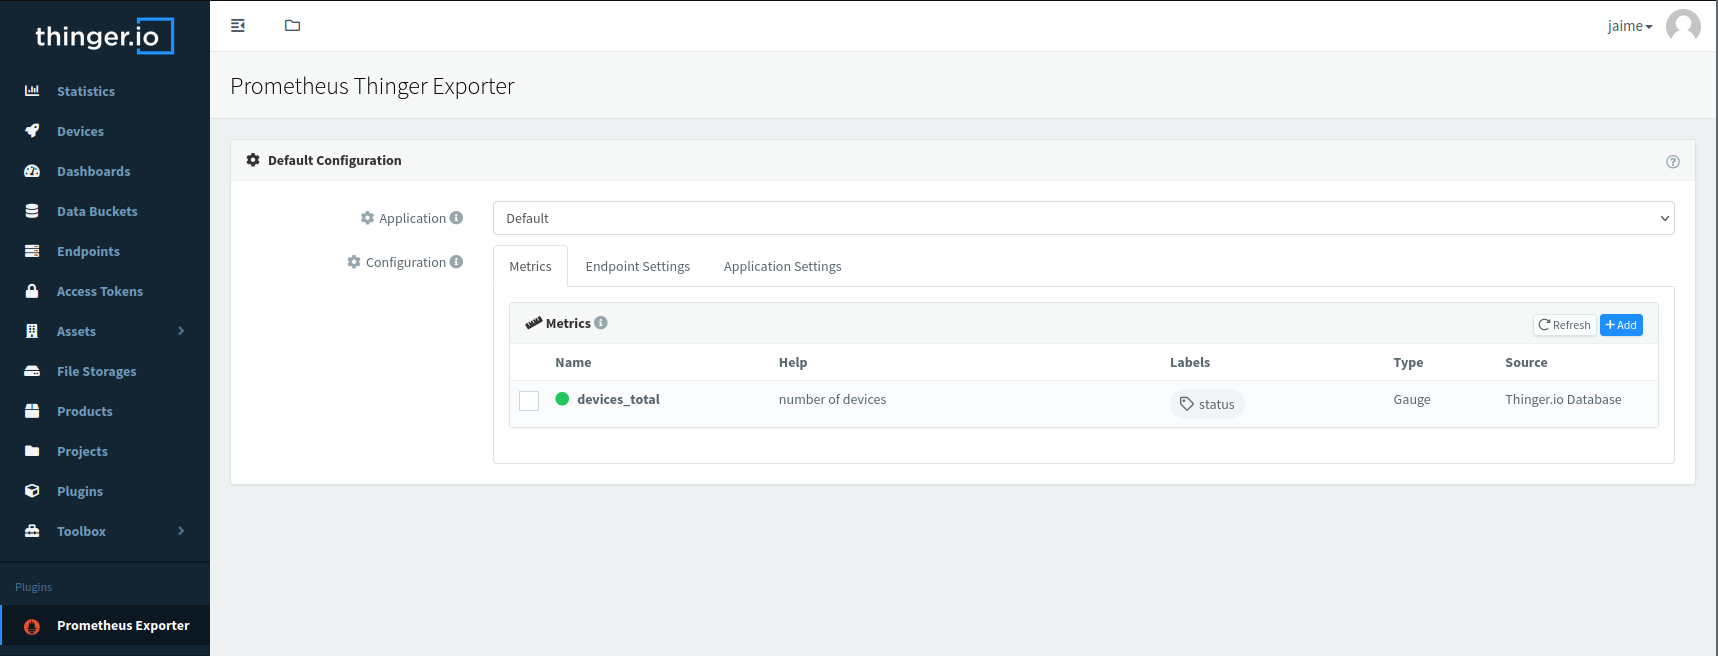
To start out with this plugin, the Default application might be used or a new one created, by selecting New Application... in the dropdown.
To create a metric, click on the +Add button in the right top corner of the metrics table, where a modal form will open.
Here you can find an example for a metric that tracks the total of devices with their status:
- Name: devices_total
- Help string: number of devices
- Labels: status
Script
- Type: Gauge
- Backend: Thinger.io Database
- Source:
const connected = db.collection('devices').countDocuments({ "enabled": true, "connection.active": { "$eq": true }});
const disconnected = db.collection('devices').countDocuments({ "enabled": true, "connection.active": { "$eq": false }});
const disabled = db.collection('devices').countDocuments({ "enabled": false});

const values  = await Promise.all([connected, disconnected, disabled]);
metric.set({ status: 'connected'}, values[0]);
metric.set({ status: 'disconnected'}, values[1]);
metric.set({ status: 'disabled'}, values[2]);
Each metric can be tested out individually, and once validated and saved, the full application endpoint can be queried, through the Endpoint Settings tab, where all needed configuration to create a Prometheus scrape job can be found.
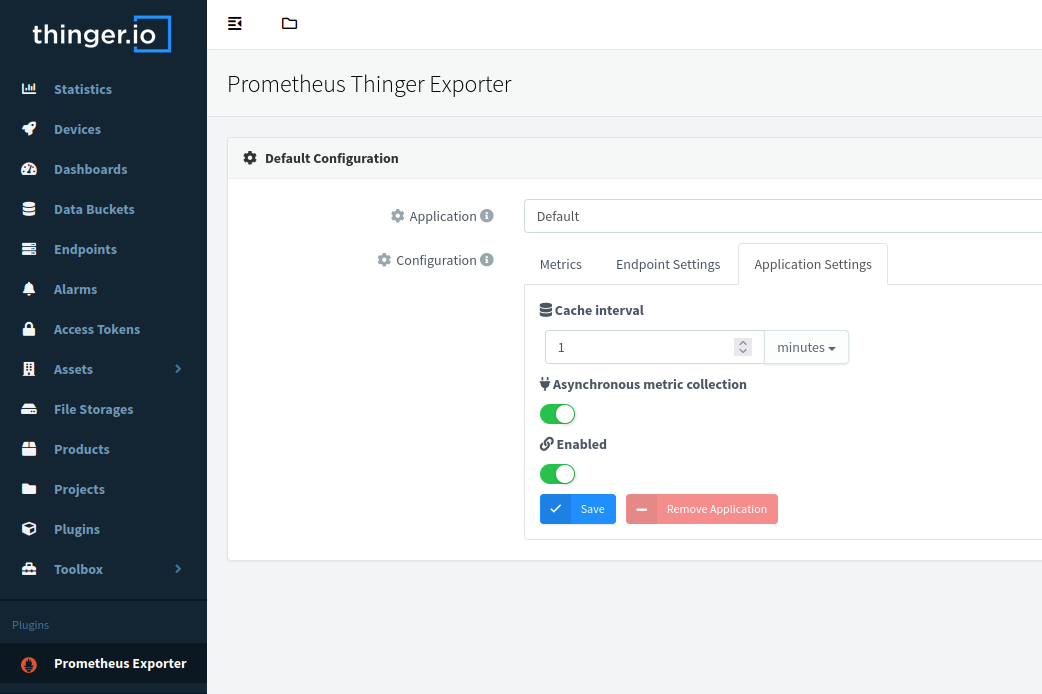
For each application there are some settings that can be configured:
- Cache: Enable and set a timeout cache for the metrics endpoint.
- Asynchronous Queries: Enable or disable the Asynchronous queries for the metrics.
- Enable: Enable or disable the metrics endpoint for the application.
Additional Resources
Given that the plugin is based and developed with Prometheus in mind, you may refer to Prometheus official documentation, and more specifically to the Data Model.
Metrics are configured using the unofficial Prometheus client for Node.js, coded through the gui of the plugin.
Also, the Prometheus Server Plugin is available within Thinger.io.
License
The class is licensed under the MIT License:
Copyright © Thinger.io
Permission is hereby granted, free of charge, to any person obtaining a copy of this software and associated documentation files (the "Software"), to deal in the Software without restriction, including without limitation the rights to use, copy, modify, merge, publish, distribute, sublicense, and/or sell copies of the Software, and to permit persons to whom the Software is furnished to do so, subject to the following conditions:
The above copyright notice and this permission notice shall be included in all copies or substantial portions of the Software.
THE SOFTWARE IS PROVIDED "AS IS", WITHOUT WARRANTY OF ANY KIND, EXPRESS OR IMPLIED, INCLUDING BUT NOT LIMITED TO THE WARRANTIES OF MERCHANTABILITY, FITNESS FOR A PARTICULAR PURPOSE AND NONINFRINGEMENT. IN NO EVENT SHALL THE AUTHORS OR COPYRIGHT HOLDERS BE LIABLE FOR ANY CLAIM, DAMAGES OR OTHER LIABILITY, WHETHER IN AN ACTION OF CONTRACT, TORT OR OTHERWISE, ARISING FROM, OUT OF OR IN CONNECTION WITH THE SOFTWARE OR THE USE OR OTHER DEALINGS IN THE SOFTWARE.

